Prior authorization transparency and reporting
Beginning in 2026, new federal rules require health plans to publicly share key information about their process and metrics for prior authorization (approval in advance for certain medical services). These changes are designed to give you clearer insight into how decisions are made and how quickly requests are reviewed—so you can make more informed choices about your care. Publicly reporting these metrics promotes transparency and accountability, helps you understand prior authorization processes, and can help you compare plans and programs
Prior authorization metrics for medical items and services (excluding drugs) for 2025
The data in the reports below show which medical services require prior authorization; how many requests are approved or denied; and response and review times for standard and expedited requests.
Standard (non-urgent) Prior Authorization Requests
|
How many times this happened |
Out of total requests |
Percentage |
|
| Total approved requests |
16,929 |
18,169 |
93% |
| Total denied requests |
1,240 |
18,169 |
7% |
| Request approved within 14 days |
16,883 |
16,929 |
100% |
| Request denied within 14 days |
1,239 |
1,240 |
100% |
| Approved after timeframe was extended (up to 14 days) |
23 |
16,929 |
0.14% |
| Request denied after timeframe was extended (up to 14 days) |
0 |
1,240 |
0% |
| Request approved after appeal |
129 |
171 |
75% |
| Request denied after appeal |
42 |
171 |
25% |
In 2025, Fallon Health received a total of 18,169 standard (non-urgent) prior authorization requests for our covered patients. 93% of those requests were approved.
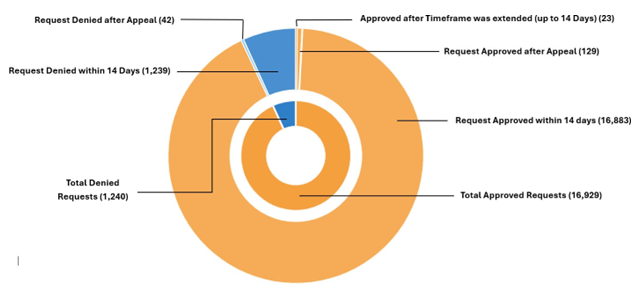
The mean (average) time that it took to make standard prior authorization decisions was 3 days. The median (middle) time that it took to make standard prior authorization decisions was 0 days.
Expedited (urgent) Prior Authorization Requests (Response Due to Provider Within 72 Hours)
|
|
How many times this happened |
Out of total requests |
Percentage |
| Total approved requests |
2,619 |
2,705 |
97% |
| Total denied requests |
86 |
2,705 |
3% |
| Request approved within 72 hours |
2,590 |
2,619 |
99% |
| Request denied within 72 hours |
84 |
86 |
98% |
| Approved after timeframe was extended (up to 14 days) |
0 |
2.619 |
0% |
| Request denied after timeframe was extended (up to 14 days) |
0 |
86 |
0% |
| Request approved after appeal |
0 |
3 |
0% |
| Request denied after appeal |
3 |
3 |
100% |
In 2025, Fallon Health received a total of 2,705 expedited (urgent) prior authorization requests for our covered patients. 97% of those requests were approved.
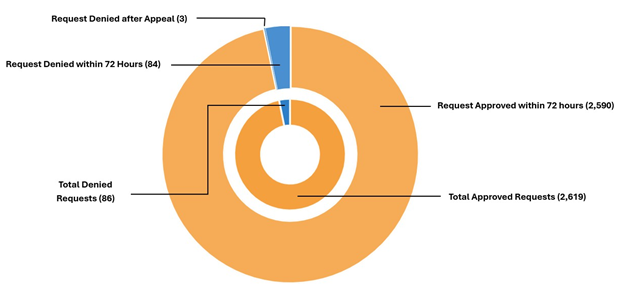
The mean (average) time that it took to make expedited prior authorization decisions was 6 hours. The median (middle) time that it took to make expedited prior authorization decisions was 0 hours.
Time Between Receiving a Prior Authorization Request and Sending a Decision
|
|
Mean (average) time |
Median (middle) time |
| Standard (non-urgent) Prior Authorization Requests (response due to provider within 14 calendar days) |
3 days |
0 days |
| Expedited (urgent) Prior Authorization Requests (response due to provider within 72 hours) |
6 hours |
0 hours |